


A Revolution in Optical Microscopy
Research at the level of single cells and cellular organelles makes a key conundrum very clear, i.e. the fact that our ability to visualize subcellular events (e.g. tracking of HIV-1 inside cells) in all 3 dimensions is greatly limited by the spatial resolution provided by conventional optical microscopes. The size of most viruses, for example, is substantially below the resolution limit of traditional optical microscopes. Over the last few years, however, dramatic progress has been made in optical superresolution microscopy. - In essence, all the optical superresolution techniques developed over the last couple of years rely on schemes that make use of our ability to control molecular emission properties in the far-field. These can roughly be separated into approaches that either try to locate individual fluorescent molecules with very high precision or approaches that reduce the probe volume by exploiting specific molecular processes.
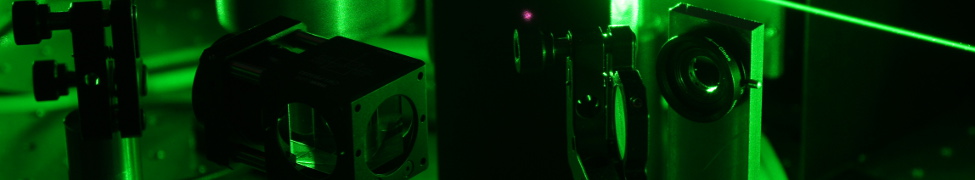
Structured Illumination - the Principle behind SR-SIM
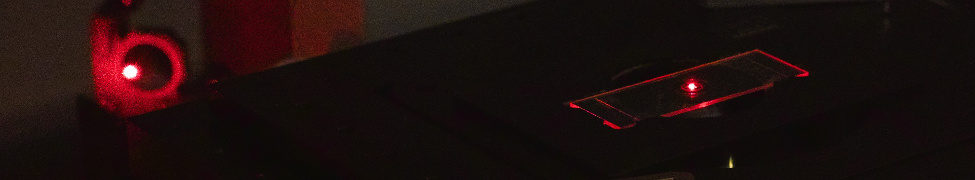
Structured illumination microscopy acquires high-resolution images of fluorescent samples by exciting them with a sinusoidal interference pattern rather than uniform illumination. No special fluorescent probes are required for this type of superresolution microscopy, but such probes are beneficial in enhancing the ultimately achievable resolution of SR-SIM even further. In super-resolution structured illumination microscopy, a periodic illumination pattern is created in the focal plane and then moved across the sample laterally and at different angles (see figure in inset).
To achieve super-resolution in 3D, typically 15 raw images have to be acquired in order to reconstruct a single high-resolution image per vertical plane. This scheme works because sample features with higher spatial frequencies than the illumination pattern are modulated by the pattern and result in beat frequencies that fall within the transfer function of the microscope. Since the periodicity of the illumination pattern is known, its effects on the image can be calculated and high-resolution images can be reconstructed. By moving the sample through the illumination pattern in the vertical direction, high-resolution images of the entire sample in all three dimensions are obtained.
Typically, a spatial resolution of approximately 100-130 nm laterally and 300 nm vertically can be achieved, but if nonlinear illumination conditions are used, e.g. by saturating the fluorescence emission or photoswitching special fluorophores, this form of super-resolution microscopy is virtually unlimited in its resolving power.
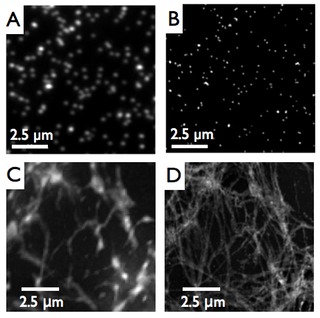
The example in the image to the right demonstrates the gain in resolution obtained by structured illumination microscopy. Panel A is a conventional fluorescence micrograph of 50 nm diameter fluorescent beads. Panel B shows the same image obtained with SR-SIM. The lower panels show a similar comparison based on the example of imaging the fibronectin network formed by rat chondrocytes grown in culture. Panel C is the conventional light micrograph, while Panel D shows the gain achieved in resolution when imaging the same sample with structured illumination microscopy.
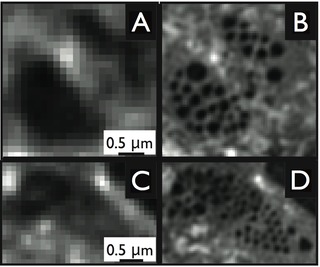
Most recently, in collaboration with groups in Australia, Norway, and the USA, we have managed - for the first time - to image fenestrations in liver sinusoidal endothelial cells by 3D structured illumination microscopy. Fenestrations are collections of nanosized pores that stretch through the entire cytoplasm from the upper to the lower membrane. These fenestrae permit blood plasma and small particles, such as lipoproteins, but also viruses to pass through these cells. The size of the fenestrae, however, has so far prohibited their study by optical microscopy. The images to the right compare typical images obtained after staining the cells with a lipophilic fluorophore (CellMask Orange, Invitrogen) and then imaging them with either diffraction-limited fluorescence deconvolution microscopy (images on the left) vs. 3D structured illumination microscopy (images on the right). Note the higher degree of detail in the 3D-SIM image. The Marie-Sklodowska-Curie Action Innovative Training Network "DeLIVER" funded by the European Commission with partners across Europe, Asia, Australia, and the USA is currently working to accelerate our understanding about the physiological functions of these cells as part of the liver sinusoids.
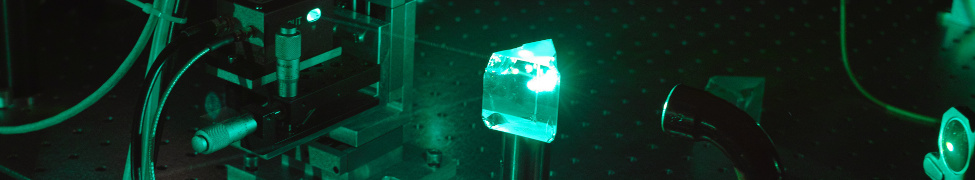
The Next Generation of SR-SIM
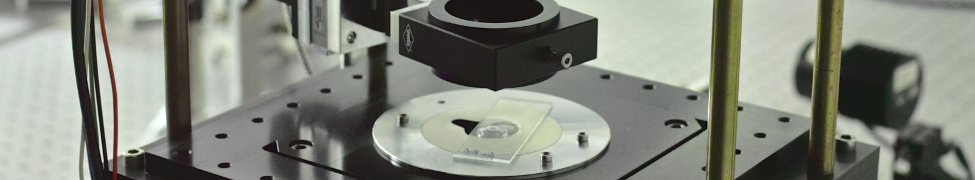
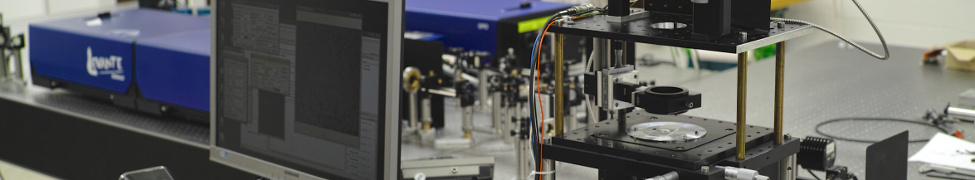
To observe fast processes in living cells, it is desirable to have setups available which support multi-color acquisition at very high frame rates. We have developed such systems based on the fastSIM approach developed in the group of Rainer Heintzmann (Leibniz Institute for Photonic Technologies, and Friedrich-Schiller University, Jena) (Biological Nanoimaging), and enhanced them by developing instant image reconstruction based on modern graphics processing units (GPUs).
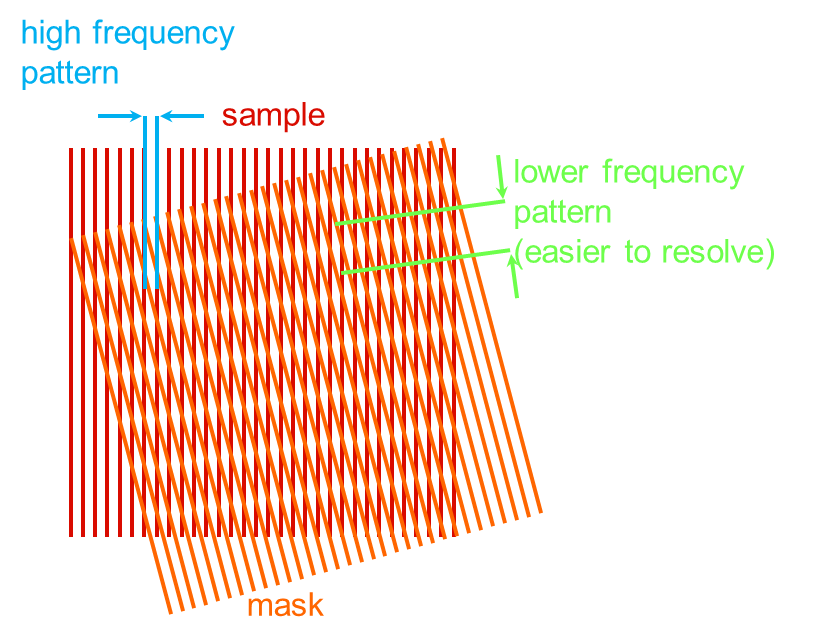
Principle of structured illumination fluorescence microscopy: Illumination with a known pattern (“resolvable moire fringe”) leads to the generation of beat signals in the resulting fluorescence image, transforming signals below the diffraction limit to above the diffraction limit.
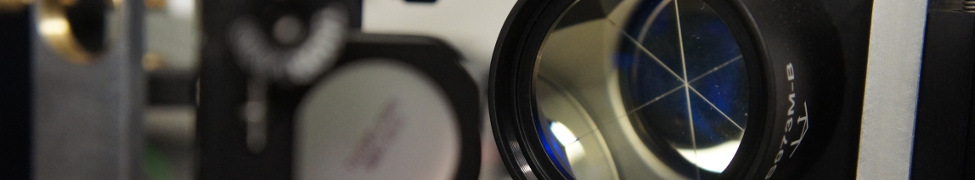
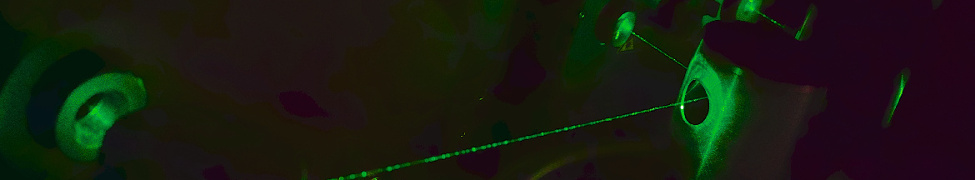
Our current 2D SIM setup is based on a ferroelectric liquid crystal on silicon (FLCoS) spatial light modulator (SLM). The microscope uses a novel approach to synchronize the different components (SLM, cameras, lasers). With one millisecond illumination time per raw frame and nine raw frames per high-resolution image, the setup can deliver super-resolved images with 40x40 µm field of view (1024x1024 pixels) at “video” frame-rates (that is 31 fps with 2 colors, 25 fps with 3 colors) and faster.
The system works in conjunction with the open source-software fairSIM that was developed in our research group, enabling on-the-fly reconstruction of the acquired raw SIM-data through GPU-acceleration of the post-processing algorithms.
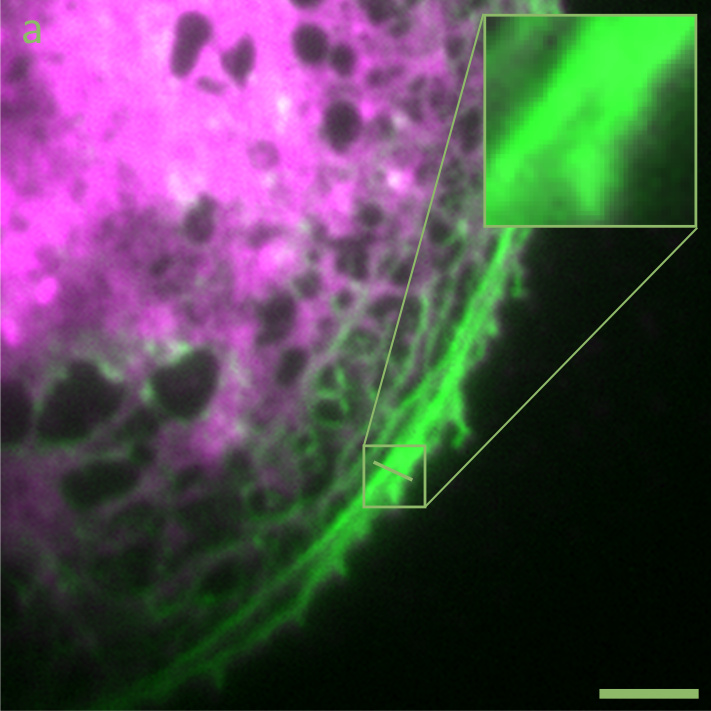

Image (a) above show a widefield fluorescence micrograph of a liver sinusoidal endothelial cell, where the plasma membrane is stained in green, and the actin cytoskeleton stained in red. Image (b) shows the same cell imaged by high-speed SR-SIM. Scale bars: 5 µm.
Publications in this area from our group
(1) C. Øie, V. Mönkemöller, W. Hübner, M. Schüttpelz, B.S. Ahluwalia, T.R. Huser, and P. McCourt, New ways of looking at very small holes – using optical nanoscopy to visualize liver sinusoidal endothelial cell fenestrations, Nanophoton. 7, 575-596 (2018)
(2) R. Heintzmann and T. Huser, Super-resolution structured illumination microscopy, Chem. Rev. 117(23), 13890-13908 (2017)
(3) M. Müller, V. Mönkemöller, S. Hennig, W. Hübner, and T. Huser, Open source image reconstruction of super-resolution structured illumination microscopy data in ImageJ, Nature Commun. 7, 10980 (2016), DOI: 10.1038/ncomms10980
(4) V. Mönkemöller, C. Øie, W. Hübner, T. Huser, and P. McCourt, Multimodal super-resolution optical microscopy visualizes the close connection between membrane and the cytoskeleton in liver sinusoidal endothelial cell fenestrations, Sci. Rep. 5, 16279 (2015)
(5) S. Hennig, V. Mönkemöller, C. Böger, M. Müller, and T. Huser, Nanoparticles as Nonfluorescent Analogues of Fluorophores for Optical Nanoscopy, ACS Nano 9(6), 6196-6205 (2015)
(6) M. Schürmann, N. Frese, A. Beyer, P. Heimann, D. Widera, V. Mönkemöller, T. Huser, B. Kaltschmidt, C. Kaltschmidt, A. Gölzhäuser, Helium Ion Microscopy visualizes Lipid Nanodomains in Mammalian Cells, Small 11(43), 5781-5789 (2015)
(7) D. Svistounov, A. Warren, G.P. McNerney, D.M. Owen, D. Zencak, S.N. Zykova, T. Huser, R.J. Quinn, B. Smedsrod, D.G. Le Couteur, V.C. Cogger, “The Relationship Between Fenestrations, Sieve Plates and Rafts in Liver Sinusoidal Endothelial Cells“, PLoS ONE 7(9), e46134. doi:10.1371/journal.pone.0046134 (2012)
(8) V.C. Cogger, G.P. McNerney, T. Nyunt, L. DeLeve, P. McCourt, B. Smedsrød, D.G. Le Couteur, and T.R. Huser, "Three-dimensional, structured illumination microscopy of liver sinusoidal endothelial cell fenestrations", J. Struct. Biol. 171, 382 - 388 (2010)
(9) T. Huser, “Nano-Biophotonics: new tools for chemical nano-analytics”, Curr. Opin. Chem. Biol. 12, 497–504 (2008)