

CARS
Coherent Anti-Stokes Raman Scattering
|
|
While Raman spectroscopy offers great intrinsic specificity unmatched by any other non-invasive technique, it often lacks the signal strength required by many biomedical applications for fast, real-time measurements. In this case, nonlinear optical approaches come to the rescue. By using tunable short-pulsed lasers, several Raman resonances can be probes simultaneously, leading to amplified signals on the Stokes as well as the anti-Stokes scattered part of the Raman spectrum. We summarize these approaches under the term "Coherent Raman scattering (CRS)".
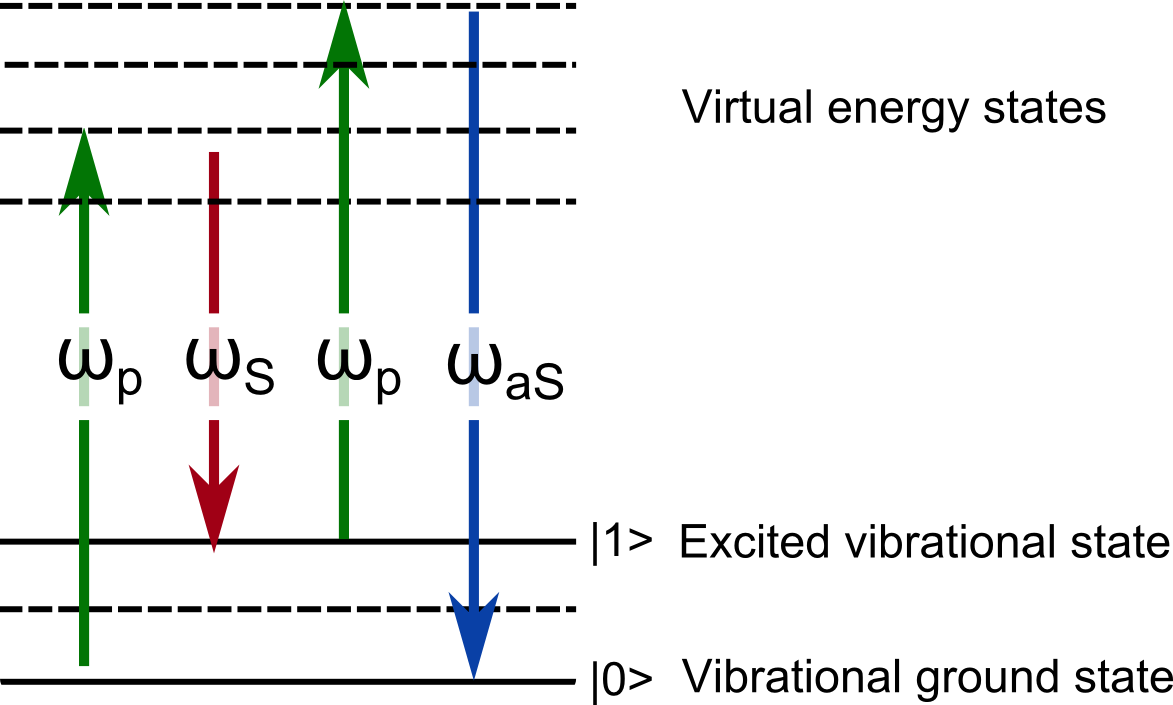
One approach to CRS is based on a pump-probe spectroscopy technique called coherent anti-Stokes Raman scattering (CARS). In CARS a signal is generated when two short-pulsed lasers are focused into the sample. In a four wave mixing process the molecular bond of interest is driven into a molecular vibration by the interplay of a pump and Stokes beam. Then another pump photon interacts with the excited molecular bond and leads to a blue-shifted anti-Stokes photon (see the sketch in the figure above). The two lasers interact nonlinearly within their overlap volume, simultaneously exciting the characteristic chemical vibration, and driving the amplification of the corresponding anti-Stokes peak. The resulting CARS signal is more than up to a thousand times stronger than the original corresponding Raman signal and can be used for chemically selective imaging without the use of fluorescent molecules.
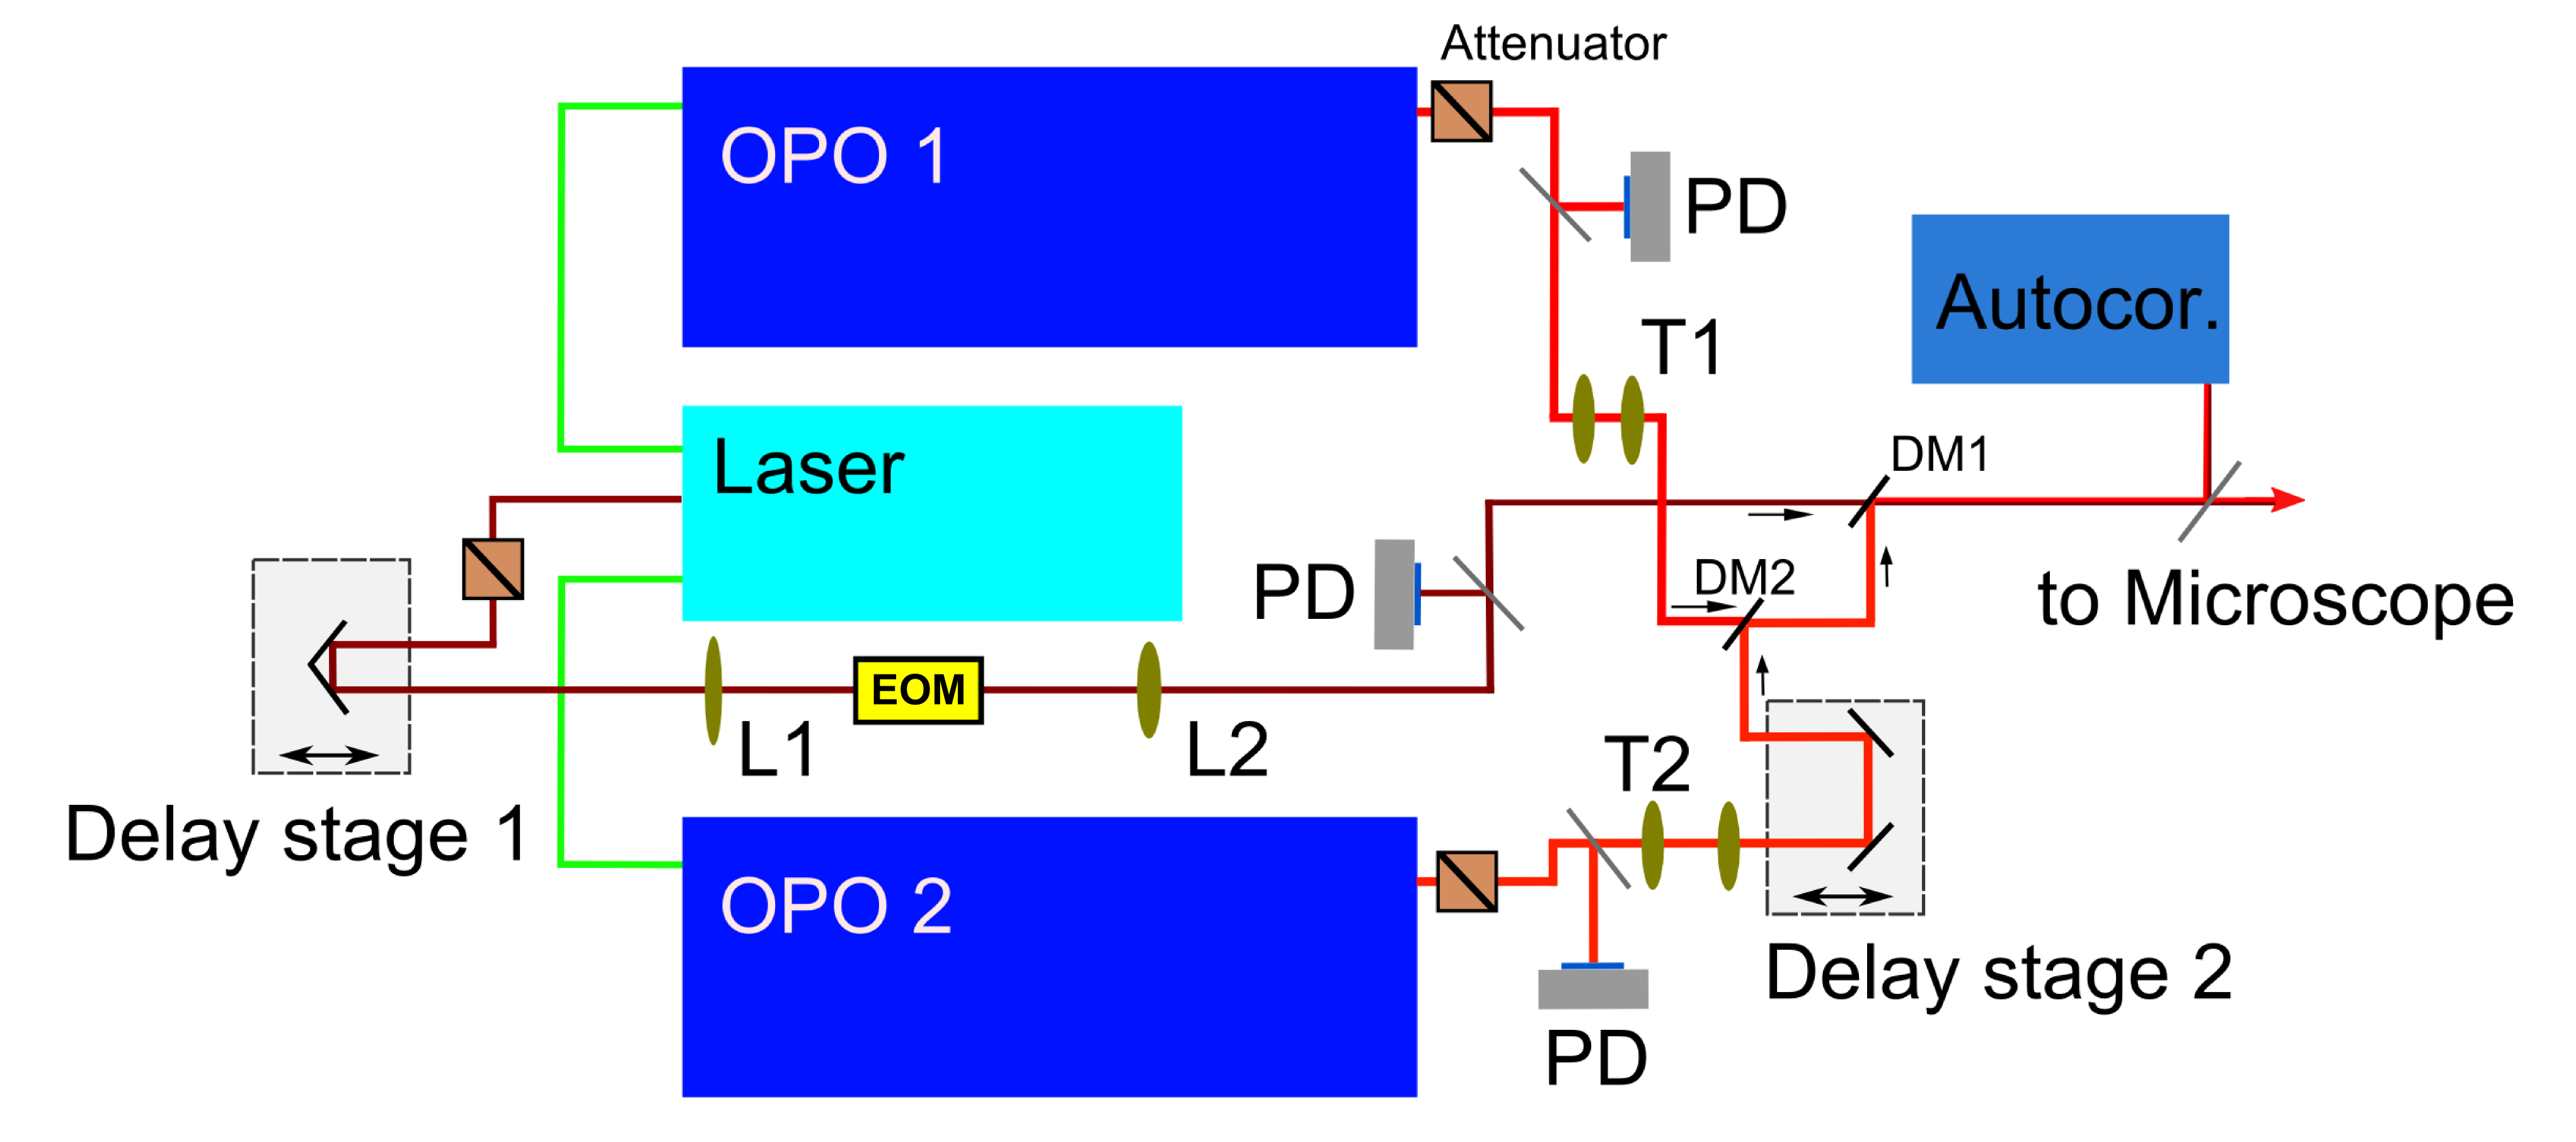
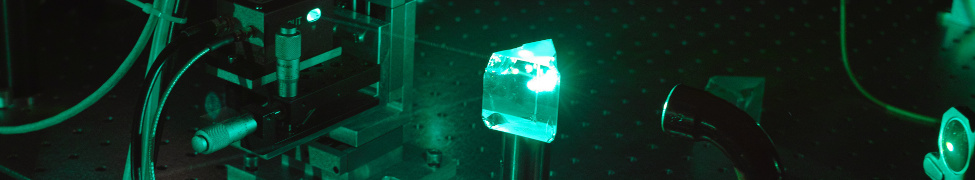
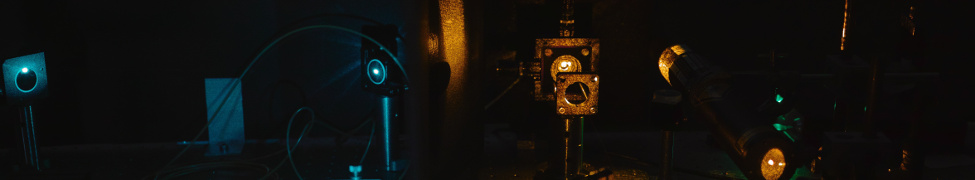
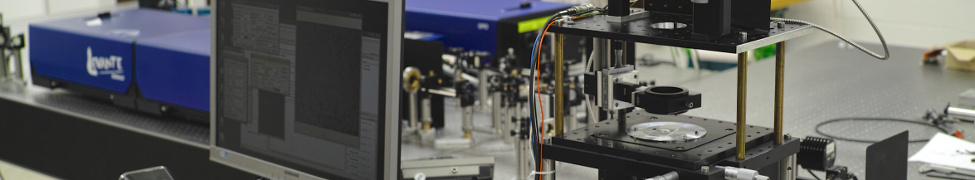
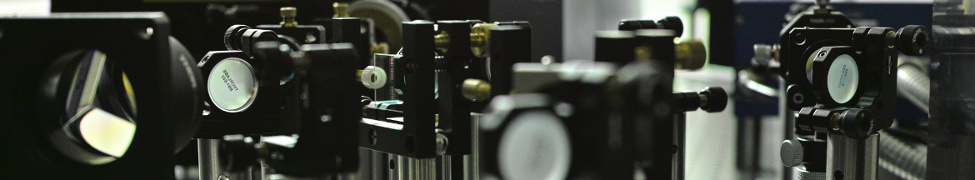
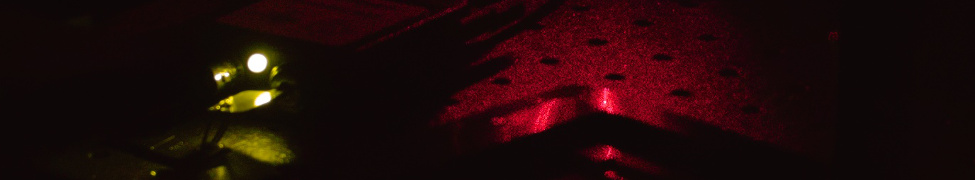
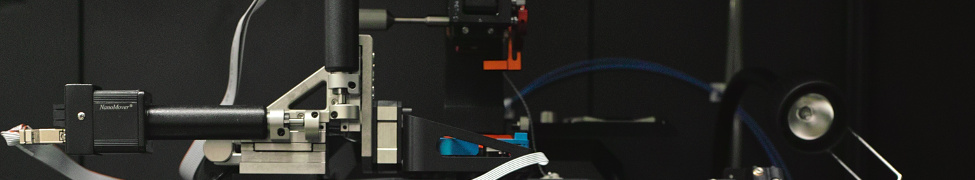
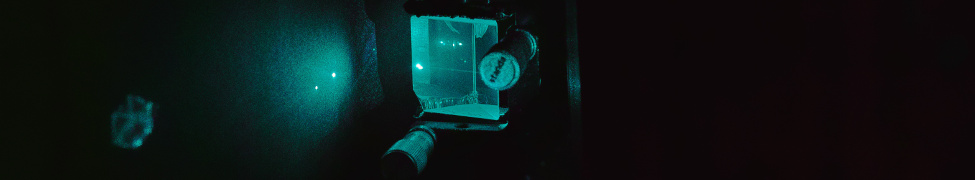
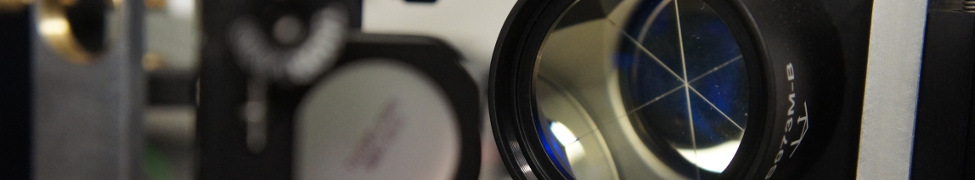
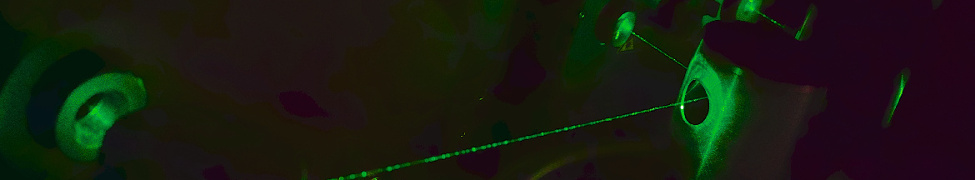
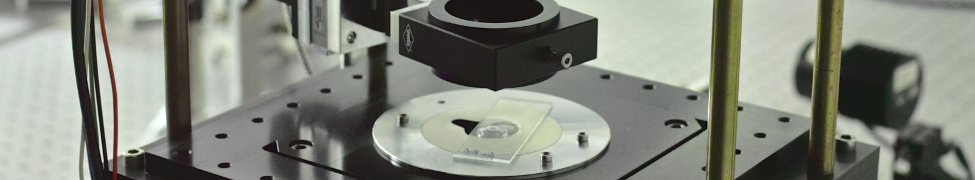
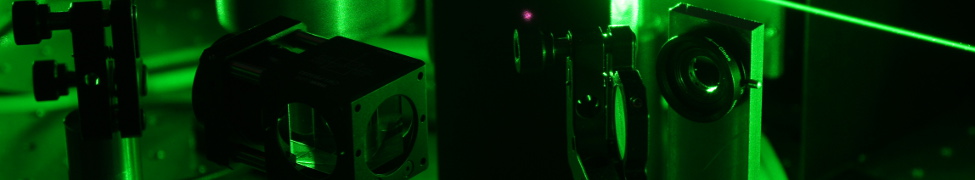
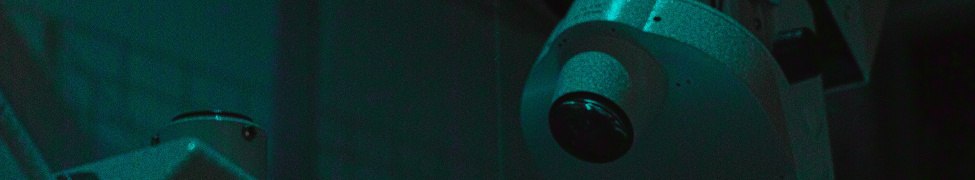
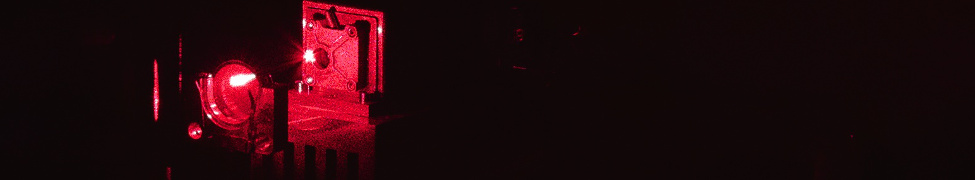
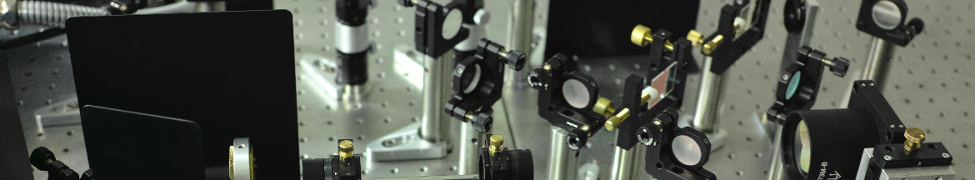
Abbildung 1 In our home-built CRS setup a picosecond laser at 1031,5nm is frequency doubled and pumps two optical parametric oscillators (OPO), which deliver a tunable laser source utilized as pump beam in the experiment. The fundamental laser wavelength acts as Stokes beam and is modulated by a resonant EOM for SRS imaging. All laser beams have to be spatiotemporally overlapped by dichroic mirrors and delay stages. The beam size and divergence is controlled by telescopes. Finally the beams are coupled into a home-made scanning microscope.
By significantly reducing the exposure time required to record the signal, CARS microscopy holds great ability for imaging living cells and tissues. By keeping the laser powers at a minimum, cells can potentially be imaged chemically and followed over very long durations - hours and days, if needed, because the signal never fades as is the case in fluorescence microscopy.
The CRS microscopy system available in our laboratory is quite unique in that it combines three short-pulsed lasers, of which two are freely tunable in a range from 690 nm - 960 nm and one is fixed at 1031,5 nm. The combination of these lasers allows us to simultaneously probe two Raman resonances and create ratio metric image contrast, or to utilize other four-wave mixing processes to exploit interference phenomena between different Raman signals. This enables us to achieve the highest possible sensitivity and specificity in imaging biological samples. The detection of the Raman signals is performed with an array of photomultiplier in forward as well as backward direction of the sample and detected by an analog-to-digital converter card and recorded via a Matlab-based microscope program (Scanimage 3.8). This allows us to collect multiphoton-excited fluorescence and CARS signals from the same sample. In combination with the intensity modulation of the laser beams and lock-in detection we can extract the CARS signal even from highly autofluorescent samples, such as arterial thin sections, where the fluorescence and CARS signal overlap spectrally.
In addition to that we utilize the amplitude modulation of the Stokes beam by an electro optic modulator (EOM) in order to perform another powerful contrast mechanism of coherent Raman imaging: stimulated Raman scattering (SRS). It has the advantage, that there is, in contrast to CARS, no non-resonant background contribution to the final image, displaying the pure Raman resonance. To generate the SRS image the same setup as in CARS imaging is used, except that the pump beam is spectrally isolated by suitable optical filter, focused on a silicon photodiode and transformed into the electronical domain. The electric signal is filtered, amplified and demodulated by a lock-in amplifier. The idea is to detect the transfer of photons from the Stokes to the pump
beam when there is a Raman scattering event in the sample (see drawing). The output signal of the lock-in amplifier is again detected by an analog-to-digital converter card. We also explore the
|
|
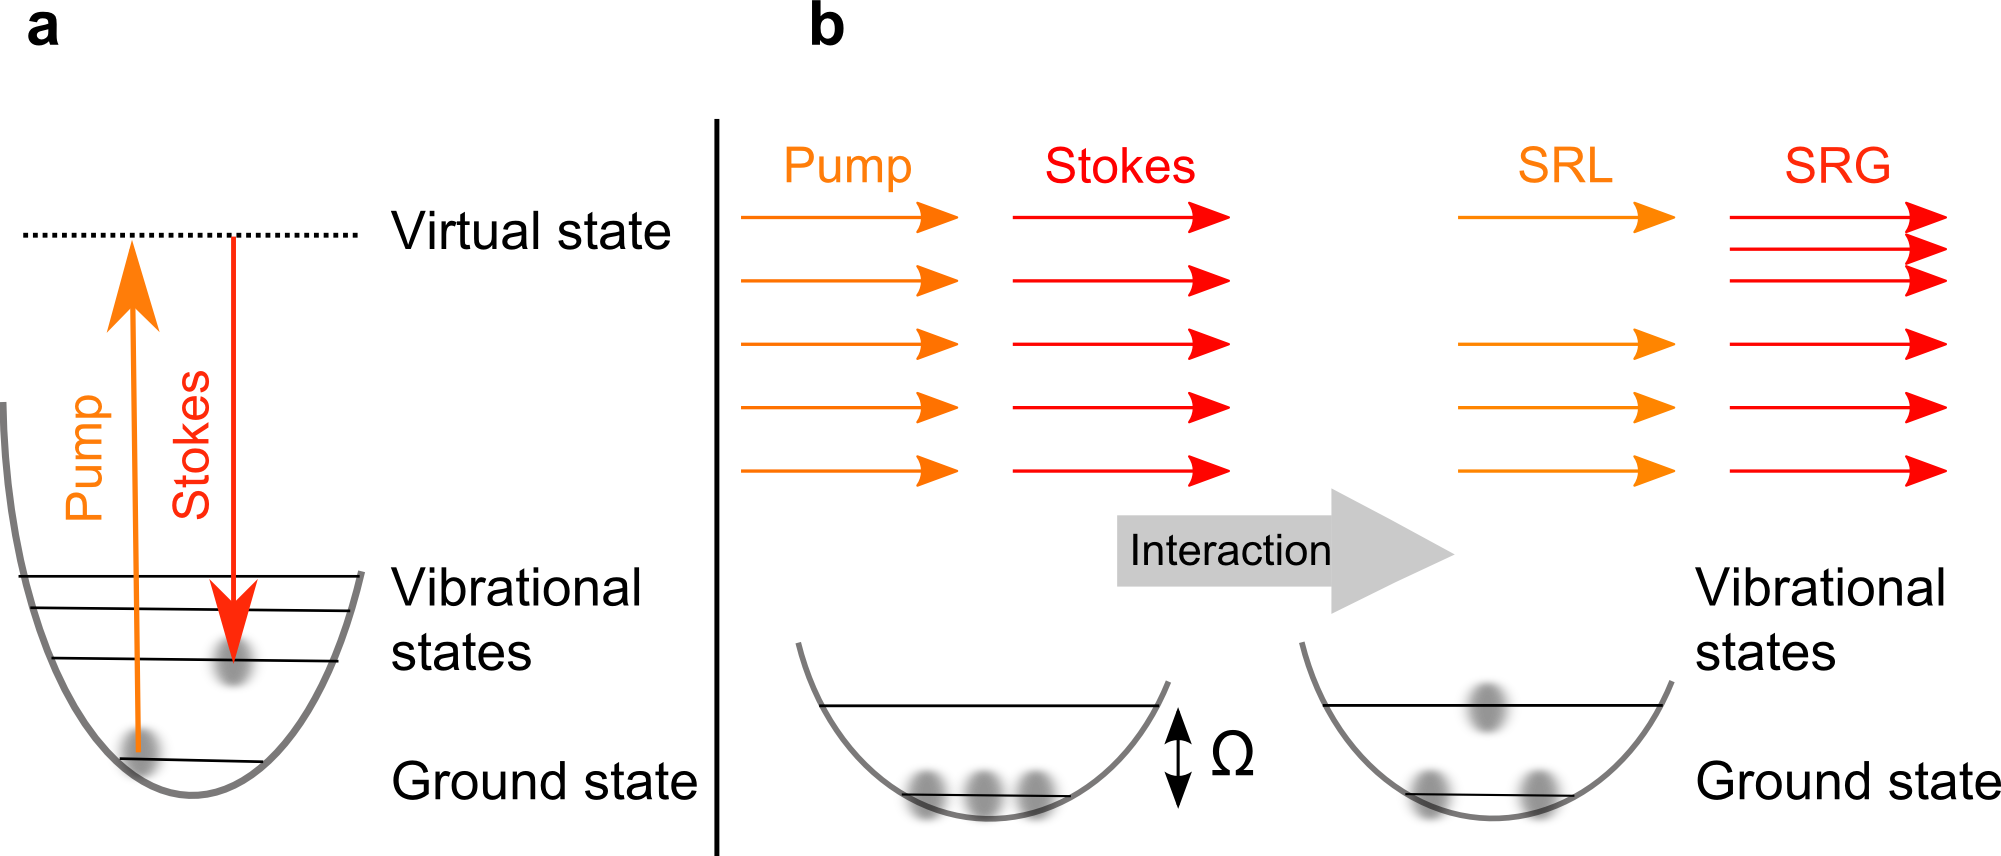
Abbildung 2 Principle of stimulated Raman Scattering
constant optimization of all needed components for this experiments such as home-built lock-in amplifiers, specialized photodiodes in combination with customized electronic filters.
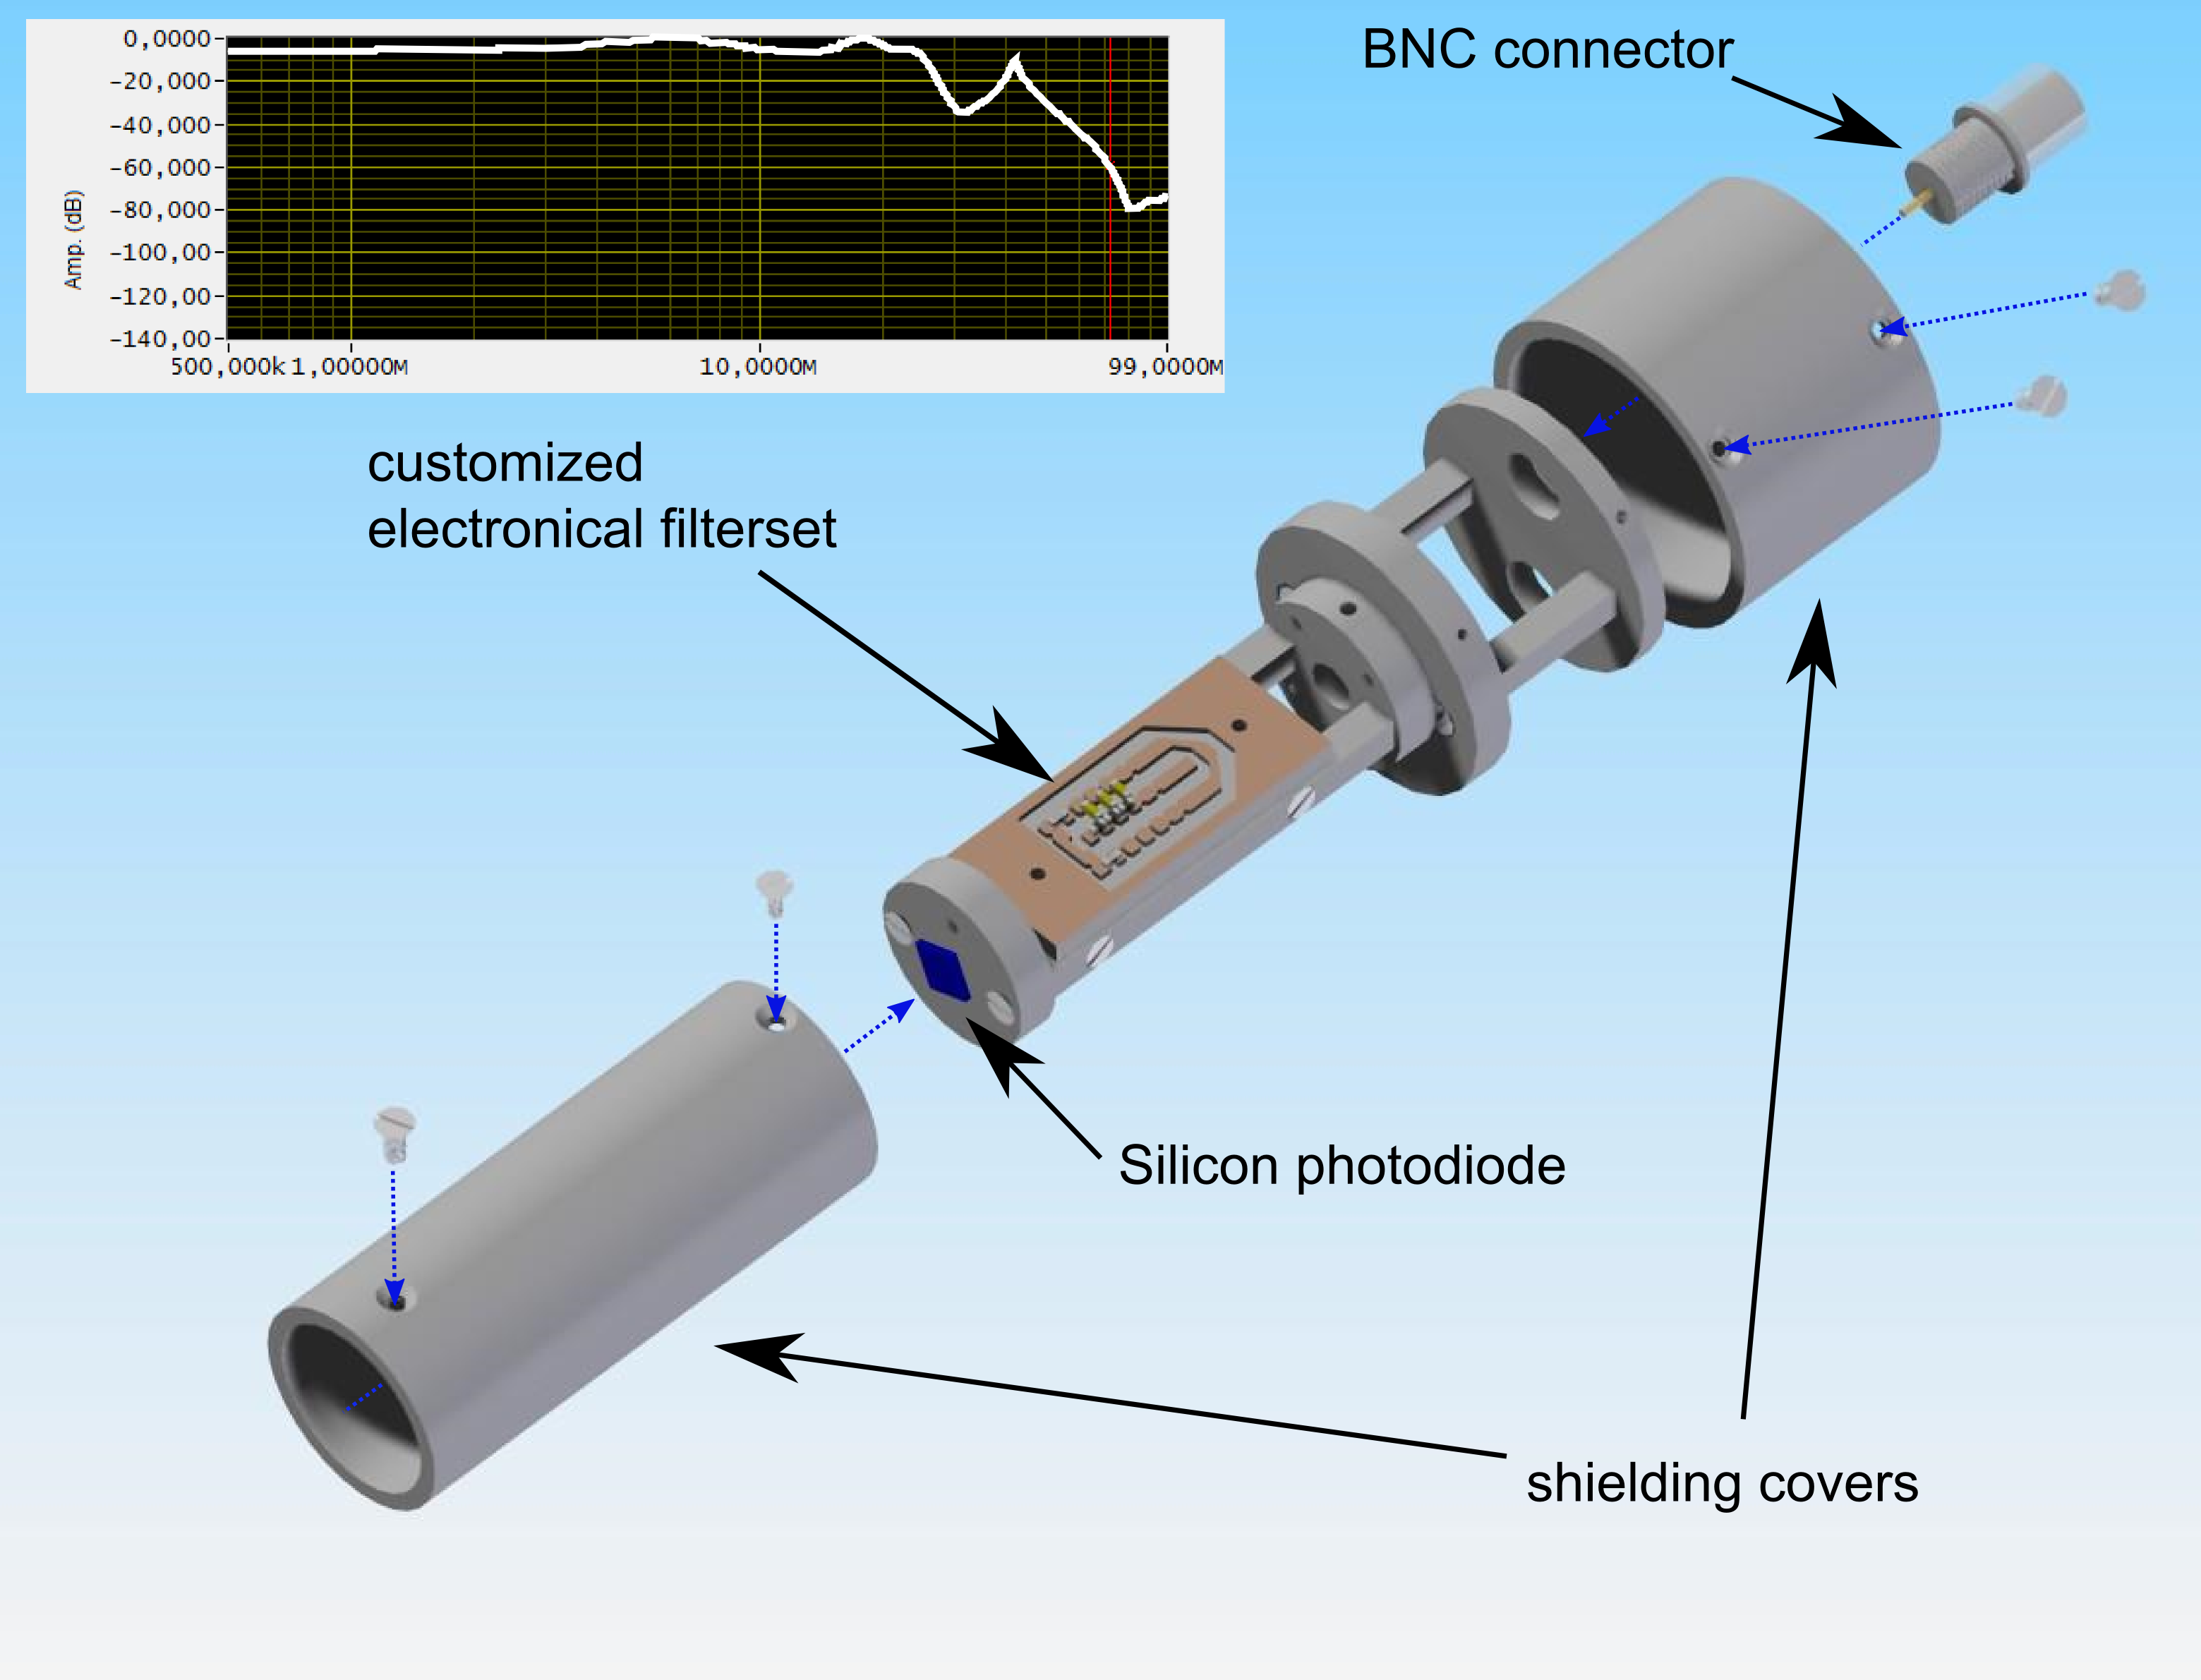
Abbildung 3 Sketch of home-built photodiode for SRS detection
As examples of our recent work in this area, we have e.g. shown that CARS combined with laser modulation is capable to image microalgae determining the fat content in volumetric scales. Here, the overlapping autofluorescence was extracted from the CARS signals by lock-in detection (see image).
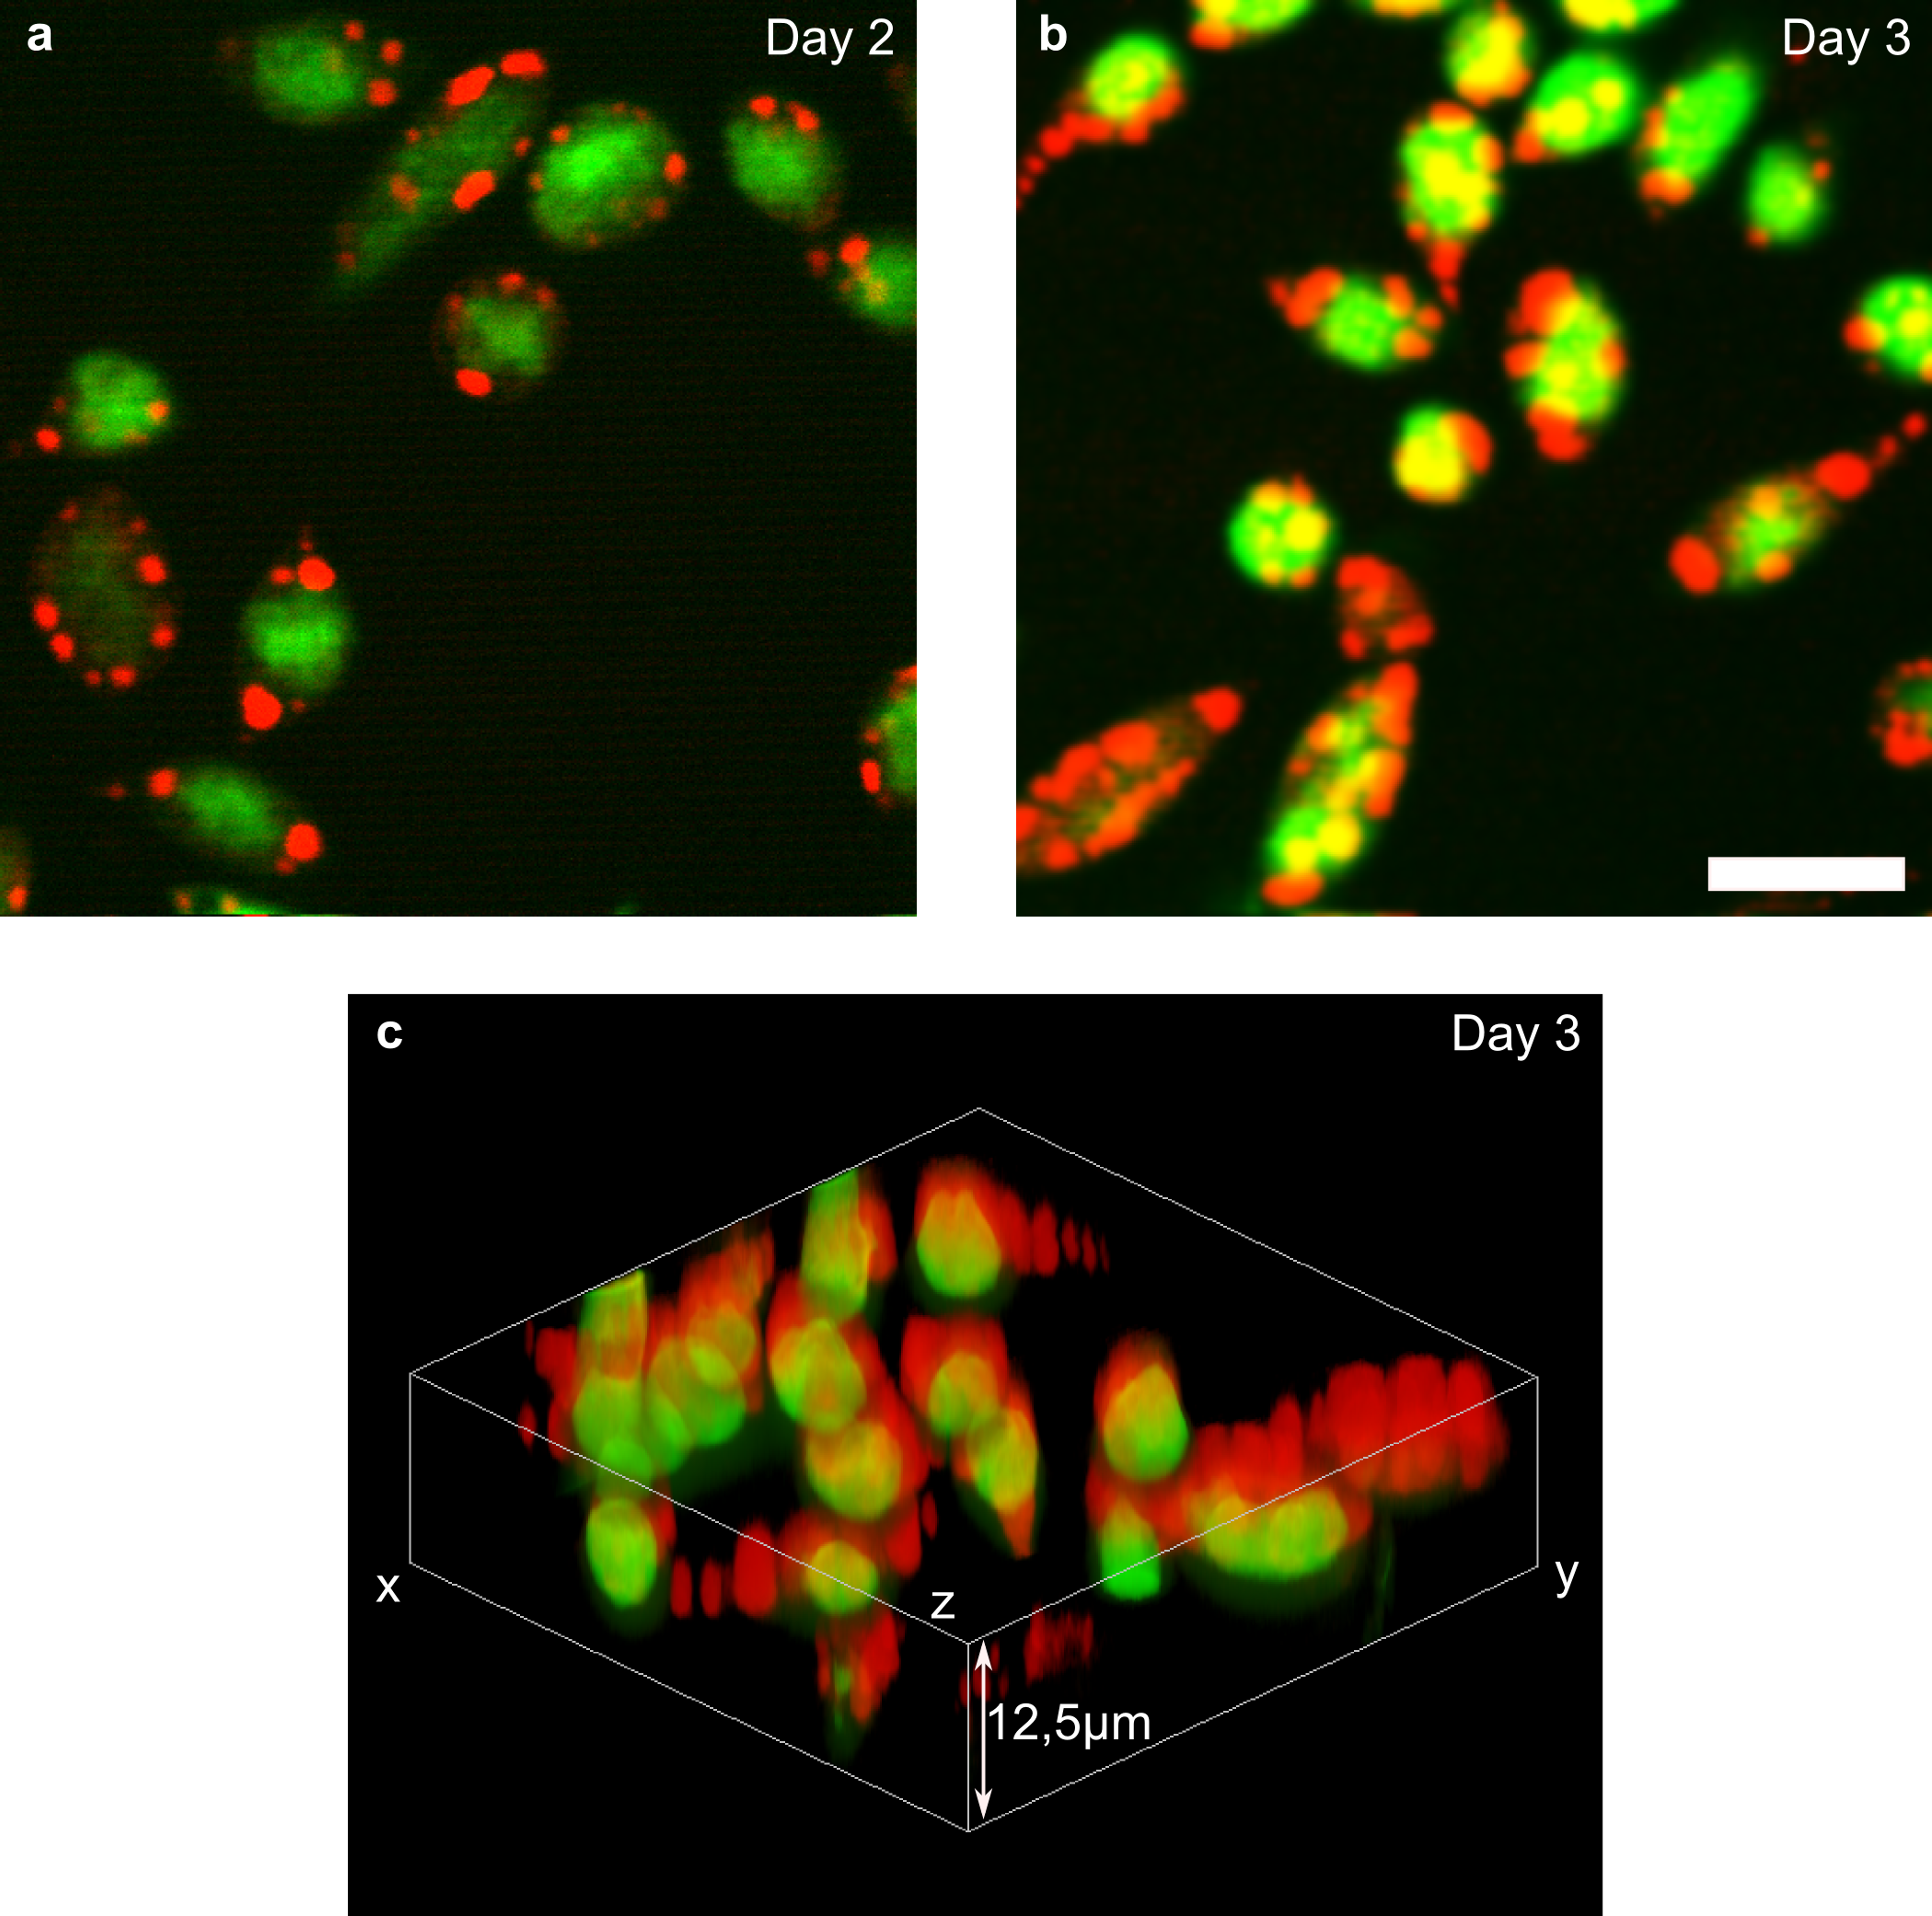
Abbildung 4 CARS and autofluorecent signals of the microalgae M. neglectum
Red displays the CARS signal probing the 2845cm-1 CH2 molecular resonance displaying the fat content, green shows the separated two-photon excited autofluoresence of the chloroplast. Scale bar depicts 10µm.
Another approach to gather more information of a sample is to scan the excited molecular resonances in a wider range. This experiment is called hyperspectral imaging, where in our case the pump beam wavelength is varied in a sequence of 10 up to 100 images, resulting in an image stack. This data set displays the spatial distribution of Raman resonances in the sample in a typical range of 2700-3100cm-1. In this way additional information of the sample can help to determine the condition of cellular compartments, or, e.g. in the case of larger samples, help to identify functional areas such as the digestive tract of a nematode. Also the identification of micro plastic inside a nematode is possible.

Abbildung 5 Hyperspectral CARS imaging of a nematode with post processed look-up table.
Roi 1 displays the digestive tract while ROI2 shows a lipid droplet. Scale bar 20µm.
In the hyperspectral scanning experiment great care has to be taken to keep the images of one data set comparable to each other. Here, the laser intensity, integrations times, focal position and all relevant parameters have to be controlled and kept constant. We also explored the impact of the pulse length variation caused by the wavelength tuning performed by the OPO and designed a method to keep the pulse length constant for all wavelengths needed (see image).
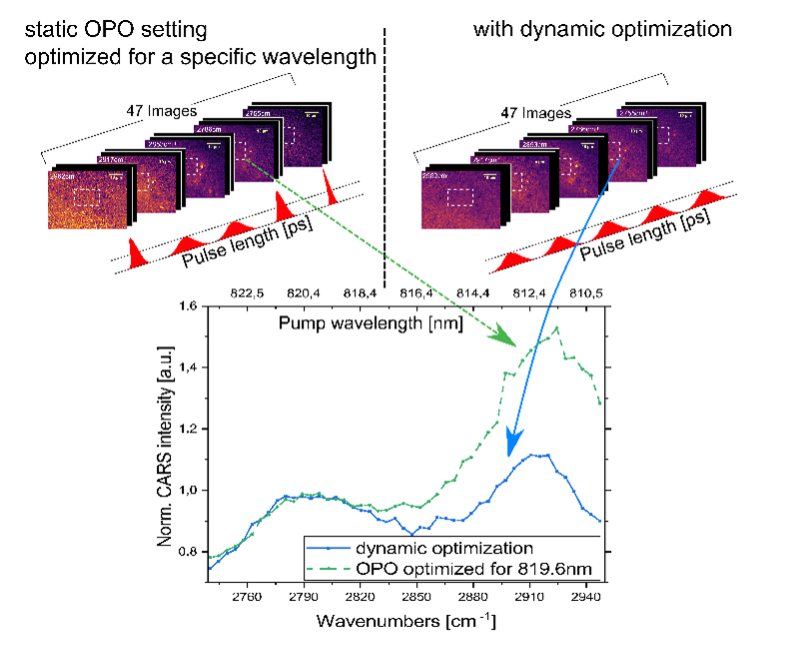
Abbildung 6 Hyperspectral CARS experiment on cells
On the left showcasing the impact of a non-stabilized pulse length on the final spectrum in comparison to our customized control program providing stable pulse length over the whole spectral range.
We are also working on the post-processing of the hyperspectral data sets applying non-negative matrix factorization and principle component analysis in order to separate the single spectral components from each other in order to generate a false-color image, which displays the spectral response of the sample in one single image.
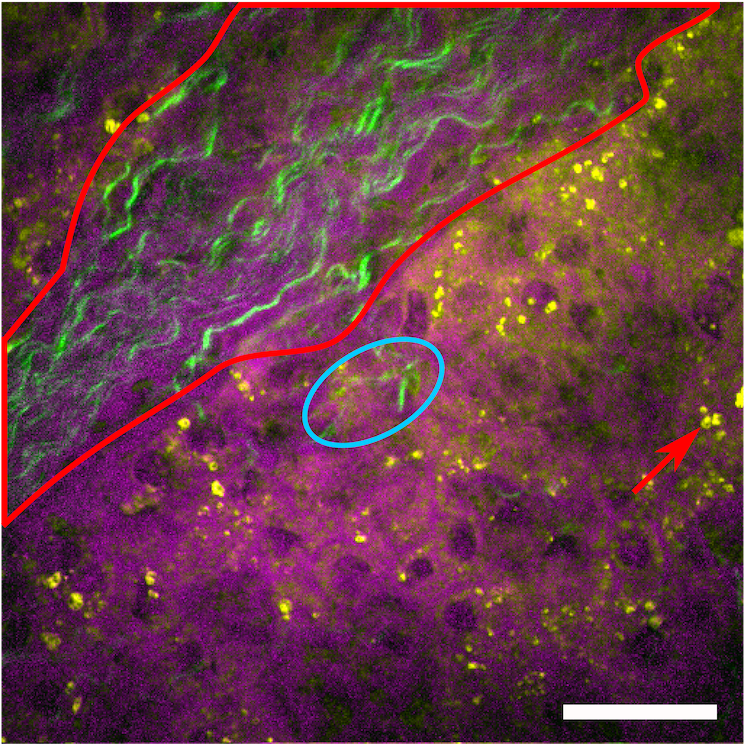
Abbildung 7 Hyperspectral SRS image in combination with SHG generation on a human liver tissue.
Magenta displays proteins, yellow the lipid droplets separated by NNMF analysis. In green the additional SHG generation is displayed, which was recorded using a home-built femtosecond laser source. It indicates the fibrotic areas in the liver tissue. The scale bar shows 30µm.
The simultaneous detection of CARS and SRS in combination with sequential SHG generation via home-built femtosecond fiber-based laser sources proved to be a nice tool for several tissue sections. The non-resonant background of CARS proved to be still useful to provide a morphological overview over the different cell types. In addition the SRS channel can be analyzed by thresholding displaying features such as lipid droplets. We apply these techniques on large field of view by moving the sample by a 3D motorized stage and stitching the single images together. SHG generation can be applied in a second step to search for fibrillary structures in the samples. Displayed below is an example of a Covid-19 infected human liver section showcasing the sinusoidal dilatation of the tissue. Here, the large field of view is very useful to study the condition of the tissue after a Covid-19 infection and the impact of this disease on the liver.
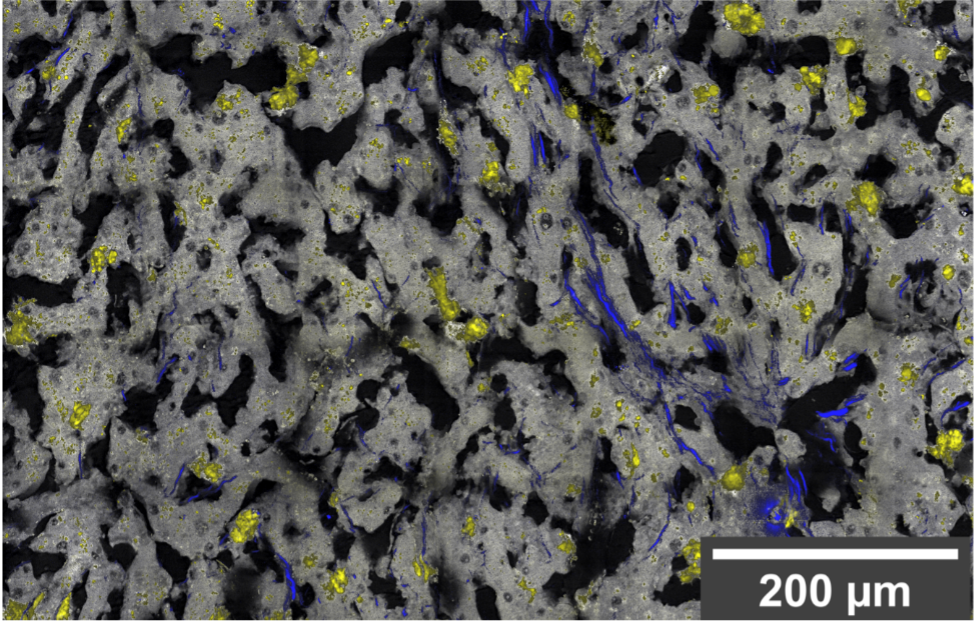
Abbildung 8 CARS and SRS imaging on human liver tissue
Grey displays the CARS signal probing the 2845cm-1 Raman resonance, yellow highlights the lipid droplets utilizing thresholding on the SRS channel, while in blue SHG signal shows fibrotic changes in the tissue.
Review articles:
- Kong C, Bobe S, Pilger C, Lachetta M, Øie CI, Kirschnick N, Mönkemöller V, Hübner W, Förster C, Schüttpelz M, Kiefer F, et al. “Multiscale and Multimodal Optical Imaging of the Ultrastructure of Human Liver Biopsies“, Frontiers in Physiology 12: 637136. (2021)
- S. Wachsmann-Hogiu, T. Weeks, and T. Huser, “Chemical analysis in vivo and in vitro by Raman spectroscopy – from single cells to humans”, Curr. Opin. Biotechnol. 20, 63-73 (2009)
- J.W. Chan, S. Fore, S. Wachsmann-Hogiu, and T. Huser, “Raman spectroscopy and microscopy of individual cells and cellular components”, Laser & Photon. Rev. 2(5), 325–349 (2008)
Recent Publications:
- Kaltschmidt B, Fitzek ADE, Schaedler J, Förster C, Kaltschmidt C, Hansen T, Steinfurth F, Windmöller BA, Pilger C, Kong C, Singh K, et al., „Hepatic Vasculopathy and Regenerative Responses of the Liver in Fatal Cases of COVID-19“ Clinical Gastroenterology and Hepatology. (2021)
- Vukosavljevic B, Hittinger M, Hachmeister H, Pilger C, Murgia X, Gepp MM, Gentile L, Huwer H, Schneider-Daum N, Huser T, Lehr C-M, et al. „Vibrational spectroscopic imaging and live cell video microscopy for studying differentiation of primary human alveolar epithelial cells.“, Journal of Biophotonics 12(6): e201800052. (2019)
- Pilger C, Hachmeister H, Greife P, Weiss A, Wiebusch G, Huser T, „Pulse length variation causing spectral distortions in OPO-based hyperspectral coherent Raman scattering microscopy“, Optics Express 26(22): 28312-28322. (2018)
- Füser H, Majdi N, Hägerbäumer A, Pilger C, Hachmeister H, Greife P, Huser T, Traunspurger W, “Analyzing life-history traits and lipid storage using CARS microscopy for assessing effects of copper on the fitness of Caenorhabditis elegans“
Ecotoxicology and Environmental Safety 156: 255-262. (2018) - Hofemeier AD, Hachmeister H, Pilger C, Schürmann M, Greiner J, Nolte L, Sudhoff H, Kaltschmidt C, Huser T, Kaltschmidt B, „Label-free nonlinear optical microscopy detects early markers for osteogenic differentiation of human stem cells“ Scientific Reports 6(1): 26716. (2016)
- Jaeger D, Pilger C, Hachmeister H, Oberländer E, Wördenweber R, Wichmann J, Mussgnug JH, Huser T, Kruse O, “Label-free in vivo analysis of intracellular lipid droplets in the oleaginous microalga Monoraphidium neglectum by coherent Raman scattering microscopy“ Scientific Reports 6(1): 35340. (2016)