

One challenging task in live cell microscopy is the quantitative identification and characterization of molecular interactions. This is typically performed by fluorescent labeling of the interaction partners with spectrally distinct fluorophores and imaging in different color channels. Common methods for determining colocalization of intra-cellular structures result in outcomes that can vary greatly depending on signal-to-noise ratios, threshold and background levels, or differences in intensity between channels.
We developed a novel and quantitative method for determining the degree of colocalization in live-cell microscopy images for two and more data channels. A Fiji plugin featuring this novel method was written, which not only enables the user do determine the degree of colocalization but also to reconstruct a colocalization topology highlighting colocalization hotspots in the image data.
The plugin was termed GICA for Gamma-norm Image Colocalization Analysis (Download page).
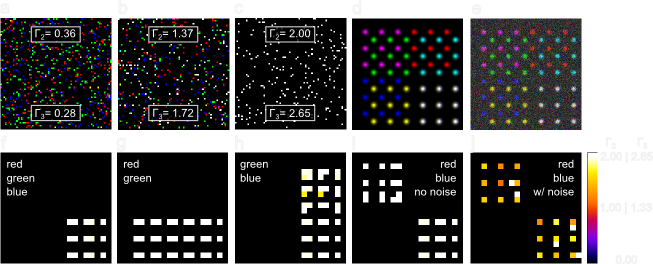
Figure 1
As a measure for colocalization we define the Gamma-norm (Γ-norm). Fig. 1 shows three test images (a-c) with three color channels each (red (R), green (g), blue (b)). The corresponding Γ-norms for two channels (Γ2: red and blue) or all three channels (Γ3) are shown for each test image. (a) All three channels feature randomly distributed pixels (no specified colocalization), (b) 25% of all the pixels were specified as colocalized, and (c) All the pixels were specified as colocalized, yielding 100% colocalization and maximum values for Γ3 and Γ2. By definition a Γ2-norm < 1 indicates no significant colocalization, while values between 1 and 2 indicate significant colocalization between two channels. (d) Manders test images are commonly used to demonstrate differing spatial overlap ratios of two channels. However, Γ-norm analysis is able to check three or even more channels for colocalization. Thus the image was modified to feature 3 color channels (RGB). (e) Specified Gaussian noise (sd=43) was added to the test image shown in (d).
 Colocalized image features are reconstructed in the Γ-norm topology images below (f-j). Each pixel in these topologies resembles the Γ-norm of a 20x20 pixel area in (d/e). A calibration bar shows the color-coded Γ-norm values of the Γ-norm topologies for two-channel and three-channel colocalization analysis.
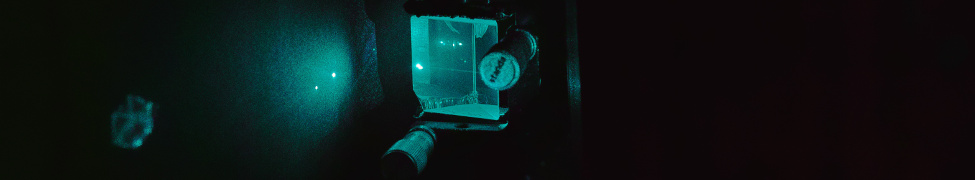
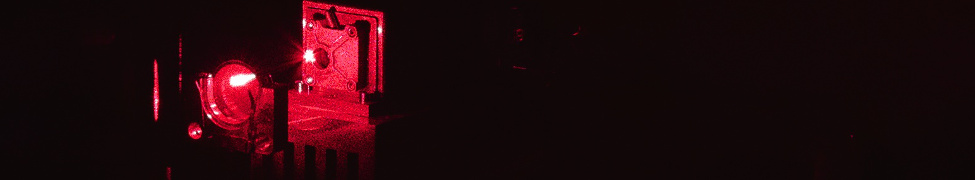
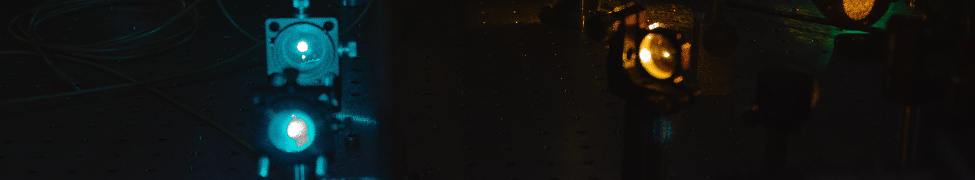
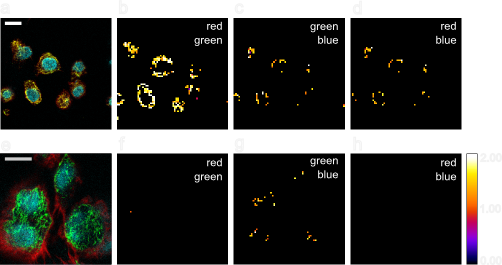
The Γ-norm topology proves to be very usefull in live cell microscopy. Example Images and their reconstructed Γ-norm topologies are shown in the figure on the left.
Recent publications on this topic from our group
-
Humpert F, Yahiatène I, Lummer M, Sauer M, Huser T. "Quantifying molecular colocalization in live cell fluorescence microscopy", J Biophotonics. 2013, doi: 10.1002/jbio.201300146.